Dashboard
After logging in (see Login), you will be presented with the main dashboard.
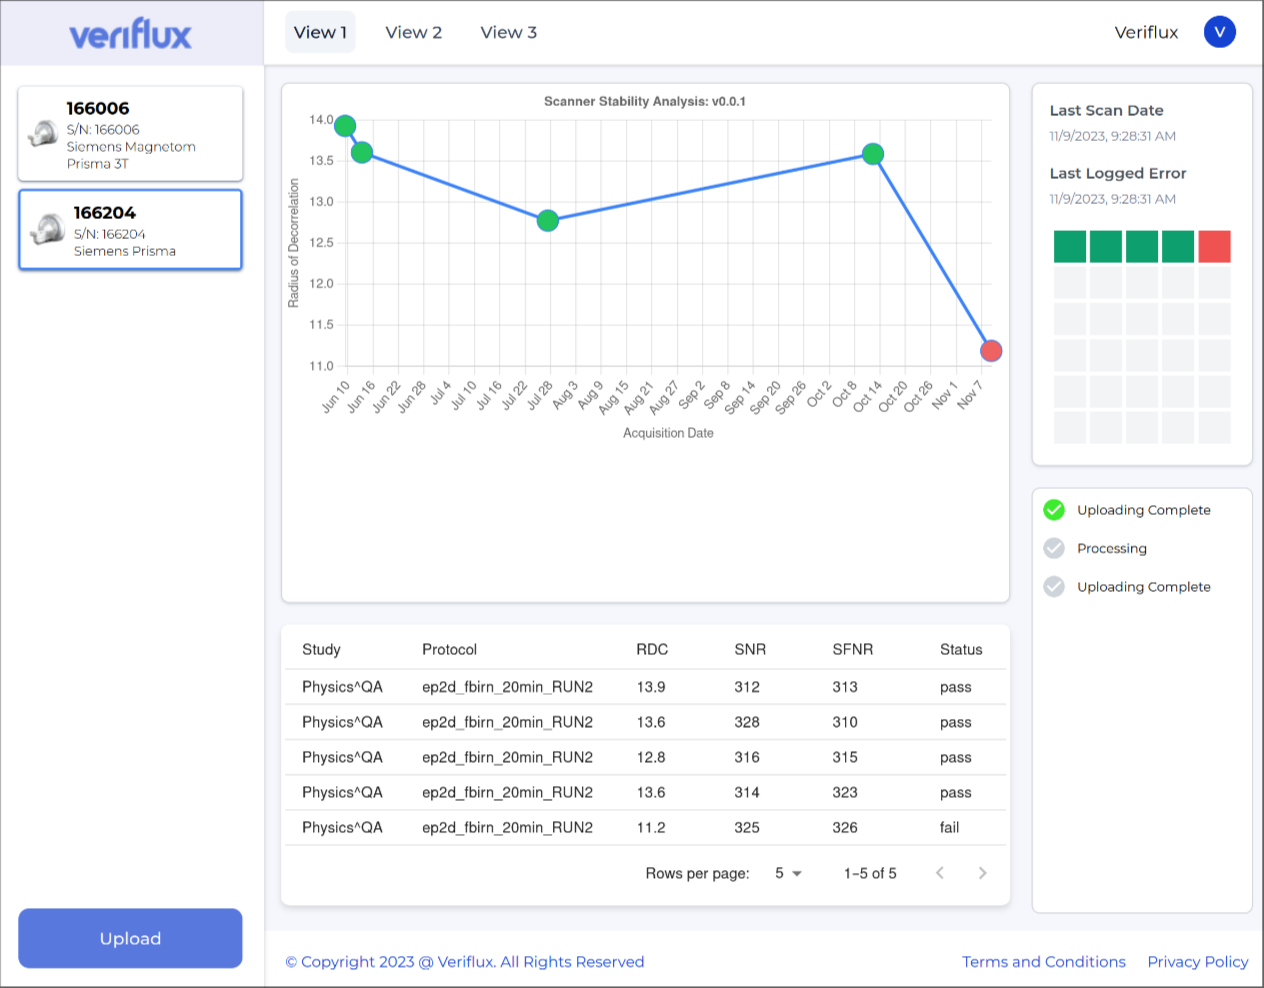
The Veriflux Dashboard
Colour coding:
Green: a pass. We have not detected any significant instability with your system.
Grey: not enough data. We do not have enough data to be able to determine the stability of your system. Carry out more fMRI scans using the Veriflux phantom, and upload them to the portal.
Red: a fail. We have detected a potential instability with your system.
The dashboard comprises:
Scanner panel: this is located on the left-hand side of the screen and details the scanners that are associated with your system.
Stability graph: the graph in the centre of the panel displays general statistics regarding the stability of your system. Hovering the mouse over a data point will provide more information regarding that particular stability analysis.
Stability table: the table at the bottom of the panel shows some statistics regarding the fMRI stability data that you have already uploaded.
Overview: the panel on the right shows a general overview of the data that have already been uploaded. See the “colour coding” section above for more details. Hovering the mouse over a data point will provide more information regarding that particular stability analysis.
Upload button: used to upload fMRI data acquired using the Veriflux phantom. For more details on uploading data, see here TO BE INCLUDED